
Charts and time ranges
Inspect price history and use chart ranges without confusing historical movement with a forecast.
Open the right place
Markets → Company → Chart
Choose a range
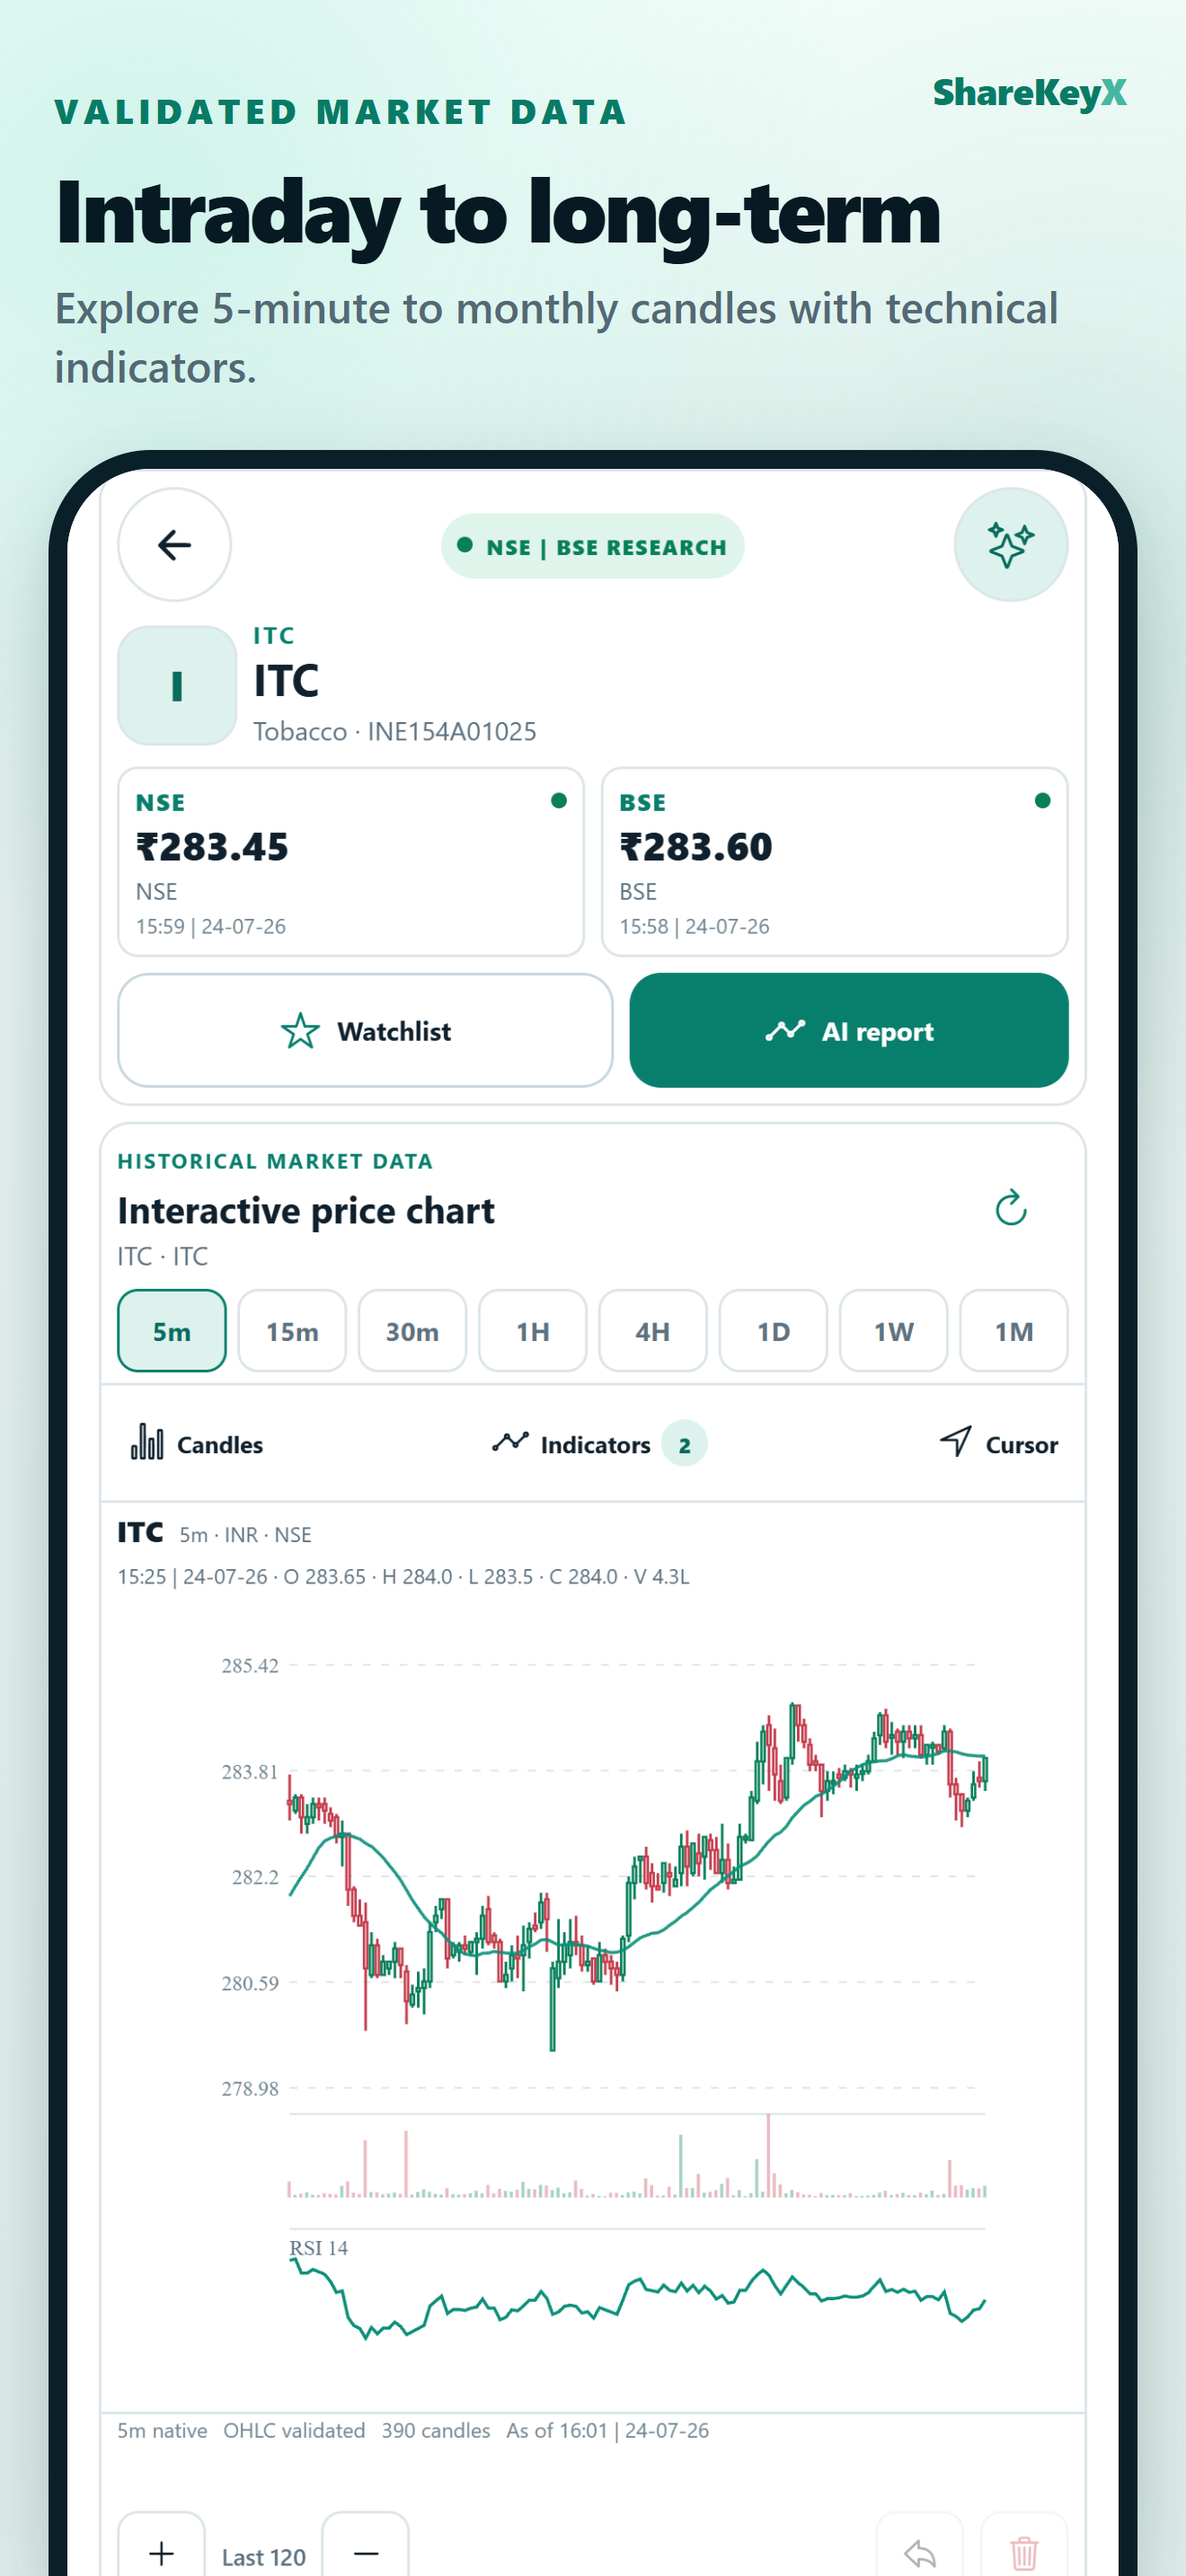
Use the available range controls to change the historical window. Check the axis, currency, exchange, and latest plotted timestamp after every change.
Interpretation
Charts describe recorded market movement. They do not guarantee execution prices, future returns, liquidity, or suitability for a particular person.
If the chart is incomplete
- Confirm network connectivity.
- Pull to refresh the company screen.
- Check whether the latest market session has closed.
- Submit a secure ticket with the symbol, exchange, time range, and screenshot if the gap remains.
Relevant screen referenceA company price chart with selectable historical ranges and timestamp context.
Verify before you leave
- The symbol, exchange, currency, and range are correct.
- The last plotted point has an appropriate market timestamp.
- Historical movement is not presented as a guaranteed forecast.